October 2024 Multifamily Market Minute
It has been about a year since we put out a market update. That is because the cost of insurance, interest rates, and economic uncertainty has sales velocity down more than 70% in the gulf coast region. Our advice to owners for the past year has been to sit tight if they are able to and that conditions should be better in 2025. In other words, stay alive until 25.
I am very happy to share that things are now improving. We are seeing insurance premiums on older properties drop more than 20% from 2.5% of replacement value to around 1.75%. We just saw a 50 bps drop in the federal interest rate with another reduction expected by the end of the year, and we should have a clearer picture of our economy after the election, now just 3 weeks away.
We have already seen an increase in sales activity. We currently have 2 value add properties totaling 250 units under contract and, so far, we have 3 high quality stabilized properties coming on the market in Q1 of 2025. I expect that to increase significantly between now and January. This window of opportunity could close rather quickly, thanks to Debbie, Helene and Milton. According to the insurance experts that I rely on, the impact of these storms will be felt in 2026 in terms of premiums.
Our advice to owners who wish to sell in the next few years is as follows;
- Renew your insurance policy in December or January. This is where you historically get the best rates. This is partly because the hurricane season is over and partly because this is when insurance companies have the most capacity for new deals.
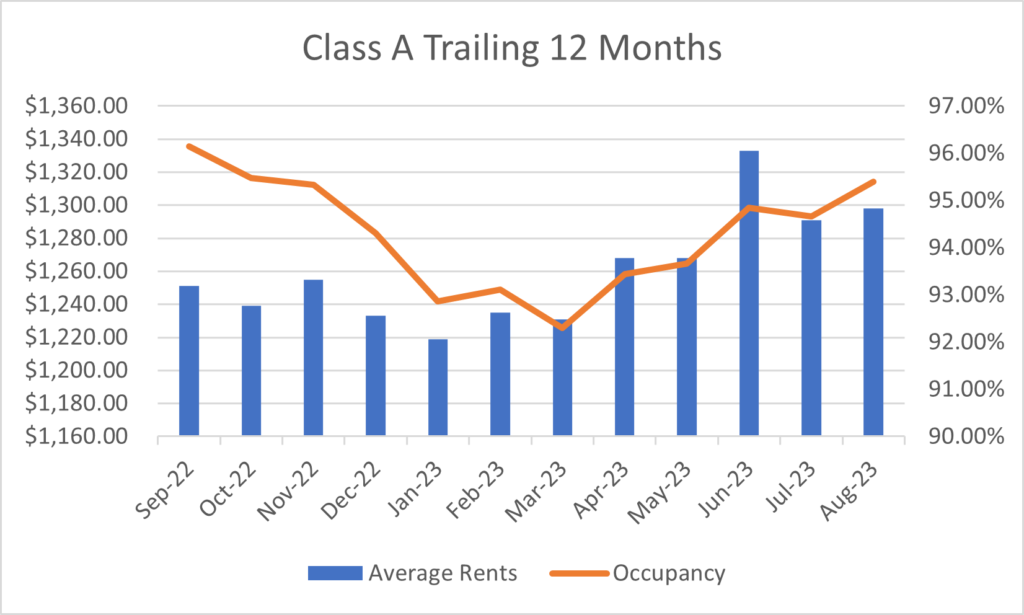
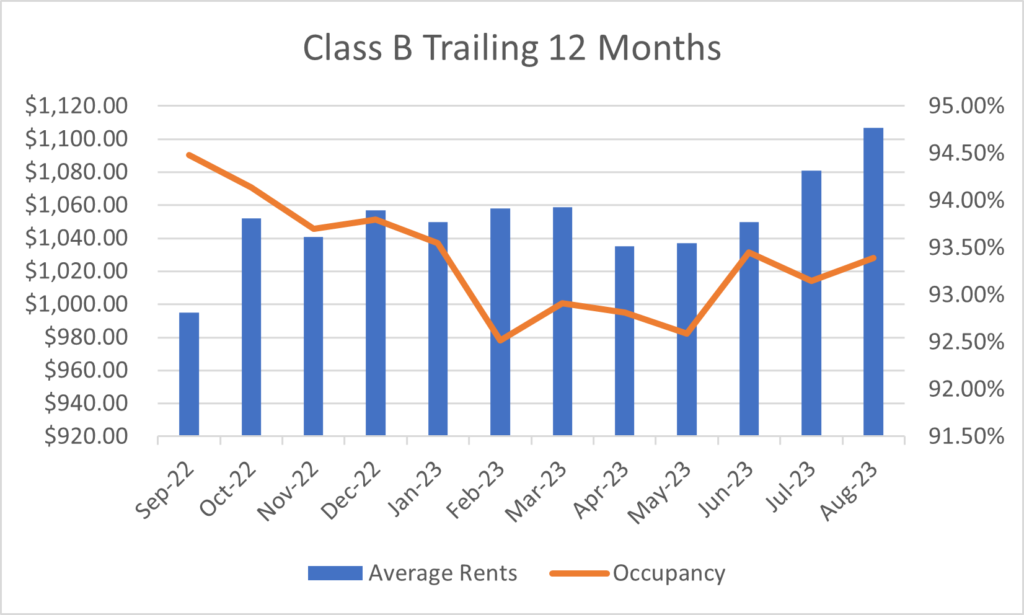
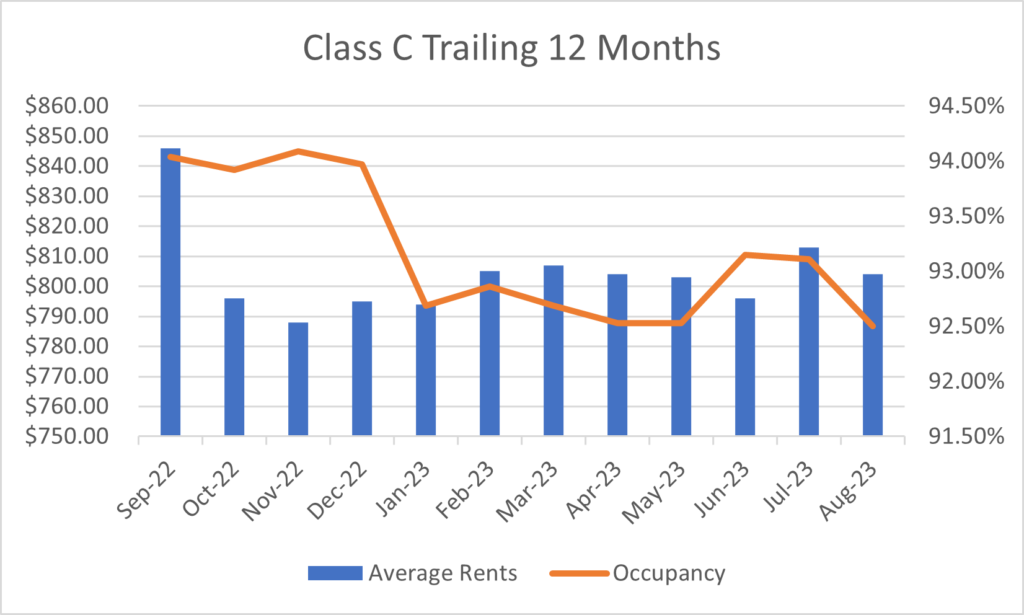
- Make sure your rents are at market rates. Every $100 per month you are below market, could mean up to $15,000 per unit in terms of sale price. If you would like to know what the market rates are in your area, reach out to us, and we will be happy to provide you with that data. We track multifamily performance metrics in south MS and south AL.
- Take care of any deferred maintenance now so you are ready when the time is right.
- Lastly, don’t accept “off market” offers. Click HERE to see a recent success story that will illustrate why. While this deal is an extreme case, the latest study I have seen showed that marketed properties sell for 19% more than off-market properties. The fear of loss is a much bigger motivator than the desire for gain.
- Wait until January to advertise your property for sale. After the election there will be less uncertainty in the market, and we may see another 25 to 50 bp decrease in the interest rate by the end of the year. In addition, most investors who are in a 1031 tax deferred exchange have already identified their replacement properties for this year.
If you have any questions or need any information, please don’t hesitate to reach out via the phone number or email below. In addition, we are happy to provide, always without obligation, a complimentary broker price opinion report on your property.
Thank you for taking the time to read our Multifamily Market Minute. We welcome your comments, questions, or future topic ideas. Feel free to forward this to anyone who you feel may be interested in this information. The Molyneaux Group exists to help real estate investors maximize their investment returns while minimizing their risk.